

Analytics#
If you’ve been following the mining farm posts so far, you’ve seen one of my previous posts on activating Initial State as the destination for the various data sources involved in determining mining performance and economics. The power of using Initial State for this the ability to perform advanced, in-browser analytics, receive real-time alerts, and build beautiful dashboards for monitoring. This post will focus on how to leverage Initial State’s Real-time Expressions and Triggers features to build a usable, powerful Tiles dashboard.
Real-time Expressions#
Initial State has a feature called Real-time Expressions available to all paid accounts. You can use Expressions as a sort of time-series data script to transform any input streams into new, combined, filtered or enhanced streams. The screen-shots I posted in my Monitoring with Initial State show Tiles visualizing the results of Expressions from as simple as converting Coinbase’s exchange rates from ETH per USD (which I’m streaming as the stream key coinbase-usd-to-eth) to USD per ETH by doing some simple inversion math in an Expression like so: =1/[coinbase-usd-to-eth]. This translates a raw value of .011055832 that is being streamed directly from the Coinbase API to a more readable number of 90.449999602. I can then round this value to to two decimal places to make it more accounting friendly like so =math.round(1/[coinbase-usd-to-eth], 2).
In addition to mathematical operations, I can actually do some “visually specific” manipulations like adding a $ to the amount to indicate it’s unit visually, so the final expression would look like this:
='$' & math.round(1/[coinbase-usd-to-eth], 2)The result is a tile that looks like this:
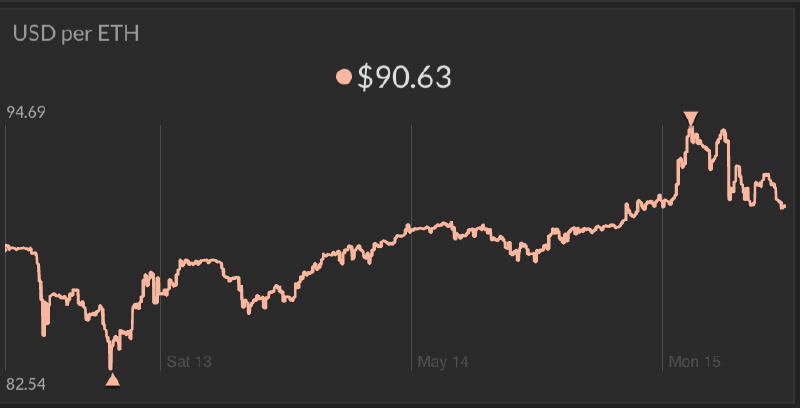
So you can see that I’ve got an effective spark line tile showing the inclines and declines of the value of Ether in US Dollars according to Coinbase. We still get all of the nice tile spark line features like automatic detection of max and min within the viewed window as designated by the arrows as well as automatic y-min and y-max controls or the ability to override them to make a more glance-able visualization by incorporating some business or domain logic into the charting.
Since Real-time Expressions give us fundamental mathematical operations, we can do even more advanced tasks like predicting farm earnings in a given time-period and then chart how this changes over time.
In my own dashboard, I graph expected monthly earnings as well as calculate other expected economics that also take into consideration mathematical smoothing to keep the noise from causing undue decisioning. In order to calculate expected earnings per month, I need to take into consideration the following factors:
- Overall Network Hashrate (
[eth_network_hashRate]): The overall computing power of the Ethereum network as measured in hashes per second - Pool Calculated Hashrate (
[nanopool_hashrate]): The calculated hashrate as per the pool awarding work-based shares of block rewards - Ethereum Block Time (
[eth_network_blockTime]): The amount of time, in seconds, it takes to solve a block by the Ethereum network - Coinbase Exchange to USD (
[coinbase-usd-to-eth]): The current market exchange to derive USD from Ether.
Essentially, in plain English, my monthly, expected earnings are determined by multiplying my farm’s percentage of overall Ethereum compute power with the overall Ether awarded per month to the whole network and the exchange rate. I also want to round this number to two decimal places, add a $ sign for visual clarity and smooth it by some factor. The ultimate expression turns out as follows (Note: I’m also ensuring I’m converting to the appropriate units for each stream):
One-liner:
='$' & math.round(smooth(((([nanopool_hashrate])/([eth_network_hashRate]/1e6))*((60/[eth_network_blockTime])*5)*60*24*30)*(1/[coinbase-usd-to-eth]), .999), 2)For a little more readability, I’ve broken it down here with some extra whitespace:
='$' & // prepend the dollar sign
math.round( // round the result
    smooth( // smooth the result
        (
            (
                [nanopool_hashrate] / ( // this is in hashes per second
                    [eth_network_hashRate] / 1e6 // convert to hashes per second
                )
            ) *
            (
                ( 60 / [eth_network_blockTime] ) * 5 // calculate Ether per min (uses 5 Ether constant as block reward)
            ) * 60 * 24 * 30 // convert to per hour, then per day then per 30-day month
        ) *
        ( 1 / [coinbase-usd-to-eth] ), // multiply by exchange rate
    .999), // smooth by a factor of .999
2) // round by 2 places
Note: I’ve used JS syntax to highlight this pseudo-like expression code with white space. This is not necessarily a syntax that Initial State supports, it just makes it easier to explain what all is going on in the expression.
The result of this expression (in addition to an identical expression without smoothing applied) is a tile that looks like this:
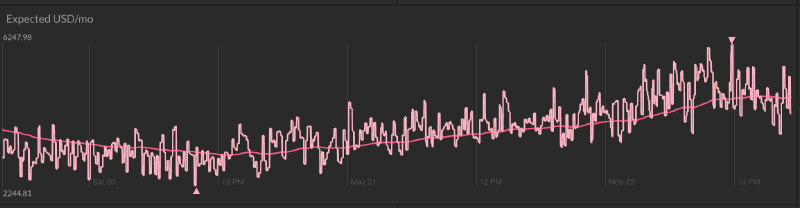
Now we can visually see a trend that is abstracting a value that is influenced both directly and indirectly by temperature, power, GPU availability, rig availability, network latency and availability, pool calculations, Ethereum network scale, and exchange rate. This provides a meaningful and valuable reaction chart of the effect of any optimizations over time.
Calculating Power Costs#
Another beautiful feature of using Initial State is the ability to calculate energy costs. Power cost calculations are very strange as they typically rely on a unit that includes time like kWh (kilowatt-hour). Most energy billers charge some amount per kWh consumption. The United States average kWh cost is $0.12/kWh. This, or the local cost, can be plugged into a Summary Tile type inside Tiles to give a windowed cost of energy when we stream in something like real-time wattage. What we can do here, is take our wattage measurement, convert it to kilowatts and then multiply it by the price-per kilowatt-hour in an expression of a Summary Tile that also considers the time basis of “hour”. The Tile settings would look something like this:
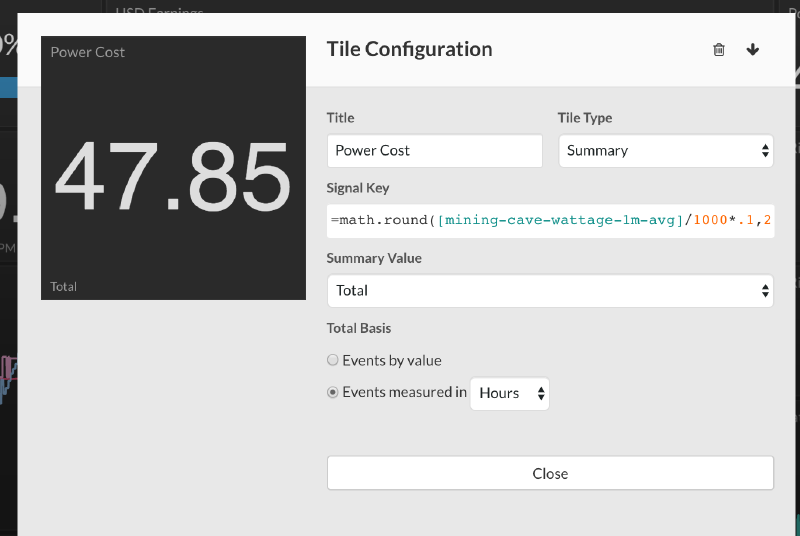
As you can see in the above image, I’m taking a signal I’m generating called [mining-cave-wattage-1m-avg], dividing it by 1000 to convert it to kW then multiplying it by .1 to consider energy costs (note that I’m also doing this inside a math.round function to get a prettier number). I then am taking the total, and using hour as the time basis. The result is $47.85 which is a power cost of all the equipment running the farm during a specific timespan.
More: If you’d like to learn more about streaming energy consumption, check out my post on emonPi, NodeRED and Initial State (coming later).
Real-time Triggers#
Expressions provide an immensely powerful way of performing client-side transformations in real-time. This is beneficial because it unlocks some powerful scripting features without the necessarily expensive server-side resources to process.
However, there are still some simple things that we’d like a third-party monitoring service to be able to bring to our attention when we’re not glued to Initial State. This comes in the form of a feature within the pro-tier of Initial State called Triggers. Triggers allow the real-time (non-batched, low-latency) evaluation of streaming data. The result of a truthy trigger is a Trigger Action (like an SMS notification).
This is a really powerful feature to leverage that allows us to get notifications when we may need to perform some sort of manual intervention (manual interventions are ultimately temporary steps we take while devising more automated, hardened recoveries in the future). As anyone who has built system recovery automations knows, the last 10% of automation can take 90% of the effort. So, to fill the gap in the mean time or as a long-term solution for the indeterminable, we can leverage real-time Triggers.
Here is an example of how I use real-time Triggers to get notifications when my GPU capacity is declining or when capacity has returned to normal.
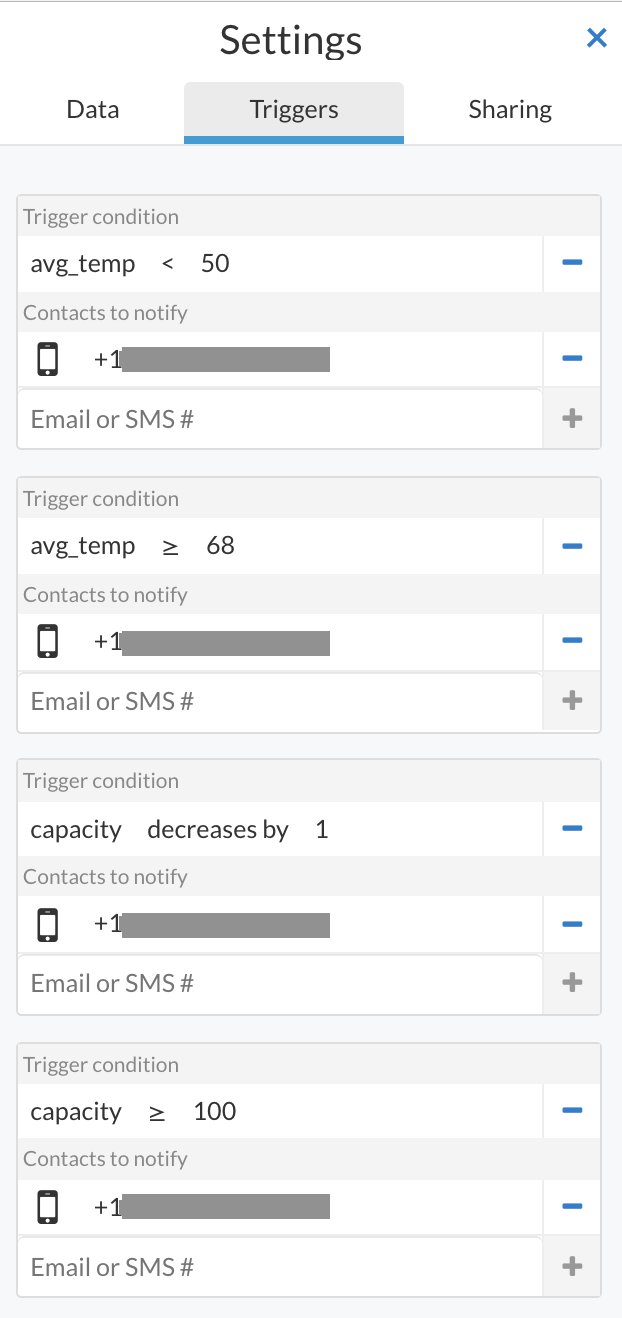
With these triggers, I can know when the Average GPU temperature of my farm goes above or below specific levels (which I use to understand if my cooling units have become ineffective). I can also know when my capacity starts dropping GPUs. I use the delta trigger here so that I can make the decision remotely whether or not I should intervene or if it’s just a small decrease in capacity (which is bound to occasionally happen and may not be worth immediate intervention like a 20% drop in capacity).
Economics of Using Initial State#
Currently, you can get an Initial State account on the pro tier for $300/yr or $30/mo, which is extremely cheap in the context of the economics of a single mining rig, especially a mining farm with multiple rigs. Because Initial State doesn’t limit the number of devices or sources, I can use a single Initial State account for an entire farm implementation. Currently, the added cost of using Initial State is a mere 3% of the overall cost of operating the farm and 1.2% of conservative monthly earnings (less than some mining pool fees). The benefits I’ve gotten from using Initial State far outweigh the costs, so the economics make complete sense.