
Disclosures/Disclaimers: 1) I am a founder and the CTO of Initial State (https://www.initialstate.com) 2) I am not a certified to provide financial advise, tax advise, or legal advise nor do I intend this post to serve as such. Use the information contained herein at your own risk, without warranty explicit or implied.
The Ultimate Mining Farm Dashboard#
Initial State is a market leader in providing visual analytics tools for understanding time-series data. Initial State’s tools lend themselves naturally as fits for the IoT use-case where you have some distribution of Internet connected sensors that send data somewhere - or at least have the ability. Common issues in distributed IoT devices arise when attempting to view data produced by these devices for a monitoring, debugging or optimizing use-case. Whether these devices are monitoring physical or virtual properties the challenges remain the same: a need to securely see/analyze data without interfering with a device’s functionality or inadvertently altering its risk landscape by opening up ingress access.
These challenges sound very similar to the challenges of monitoring mining rigs. Ultimately, we need the ability to understand the performance and conditions of the GPUs, rigs, and general farm economics. This runs the gamut of requirements from a BI dashboard all the way to a logic analyzer. Fortunately, Initial State is well suited to solve these challenges and at a price tag that creates a ton of return value to the mining operation.
The High-level Architectural Setup#
Initial State makes it easy to send data to your account. It’s a simple-to-use HTTP API which allows a lot of interoperability without a massive buy-in to a specific IoT protocol or technology. If you’ve already assembled a rig with the equipment I posted earlier then you should be familiar with the fact that we’ll also be leveraging ethOS for our mining rig operating system. This provides a significant advantage in time-to-provision as the OS comes ready to mine right out of the box. Another thing that ethOS provides, is an already baked-in methodology for showing a web-based view of data. They have some light time-series visualization support already by leveraging Highcharts, but not quite what we need. Not to mention, it’s only based on a single farm’s data, and doesn’t utilize any non-ethOS tools, sensors or other services in the same view.
In order to achieve this architecture, we’ll leverage a common custompanel in all of our mining rig configs for ethOS. We’ll dig deeper into this later, but this is important here to give us an API for our rig mining data as well. The custompanel will be accessible by going to the url <<custom>>.ethosdistro.com (where <<custom>> is the first 6 characters of your custompanel configuration) in a browser. To access this same data through a JSON api, you can use the url <<custom>>.ethosdistro.com/?json=yes.
You’ll want to note in the ethOS knowledge base how to setup a custom panel ID that all of your rigs can share:
… in your config, set custompanel publicsecret (exactly 12 characters) where public (exactly 6 characters) is your preferred panel ID, and secret (exactly 6 characters) is your private key. Then, reboot. [snippet from ethosdistro.com]
In addition to the ethOS farm API you’ve constructed by configuring your individual ethOS rigs, we’ll also be leveraging the following APIs:
- Coinbase API: to collect exchange rate data
- nanopool ETH API: for collecting mining pool stats
- Etherchain API: for collecting ETH Network stats
We’ll be pulling data from these three service APIs as well as the ethosdistro.org API at polling intervals and then sending this data to our account in Initial State using Initial State’s Events API
To perform the interval polling, we want to make sure we do this outside the private network our mining rigs are operating. The reason we want this separation is an additional layer of network redundancy. We don’t want a power outage or network outage at the farm’s location to take down the monitor polling as well. This gives us the ability to receive alerts and still perform actions should something go awry.
The best option for running our remote polling code is AWS Lambda. AWS Lambda provides a serverless way for us to run code on a scheduled, recurring basis to do the work we want (like polling the above APIs) and sending the results to Initial State in order to keep a data history as well as to power our triggers and notifications.
If you’re not familiar with AWS Lambda or AWS in general, I suspect you’ll thoroughly enjoy getting familiar with it during this project.
Configuring ethOS#
Once you have your first rig assembled, you’ll want to configure ethOS to start doing work for you. ethOS has a very easy configuration process. I’ll go over the parts unique to this series of posts but leave the rest to the well documented and refreshingly concise ethOS knowledge base. The gist of the rig’s configuration is that it operates off one of two files in the /home/ethos directory called remote.conf and local.conf. Out of the box, ethOS is setup for local configuration, which means remote.conf is blank and local.conf has a default config file. I recommend using a remote configuration scheme in order to make distributing a canonicalized config easy.
ethOS has a remote configuration tool called ConfigMaker which seems easy enough to use. However, I decided that I wanted my config files version controlled along side my monitoring and deployment applications so I created a private git repo on GitHub, generated a personal access token and created a url following this formula:
https://<<PERSONAL_ACCESS_TOKEN:x-oauth-basic@raw.githubusercontent.com/<<GITHUB_USER>>/<<GITHUB_REPO>>/master/miner.conf
Note: You’ll need to replace
<<PERSONAL_ACCESS_TOKENwith the one generated from GitHub as well as the<<GITHUB_USER>>and<<GITHUB_REPO>>with their respective values. For more advanced users, you’ll want to take note of the branch and filename in the path as well.
The resulting url is what we’ll take and put as the only contents of the /home/ethos/remote.conf file. In the background, ethOS has a cron task that runs at least every 10 minutes that fetches content at the url in the remote.conf and loads it into the local.conf file, overwriting it every time. It then applies any configuration changes. For those familiar with configuration management tools like Puppet or Chef, it’s kind of like a master-less, lite version of a configuration manager. In my experience, it works very well.
If you want to see what this would look like and validate that your url is correctly formatted, you can perform the following from withing the ethOS prompt:
$ curl `cat /home/ethos/remote.conf`and check the output.
With the file stored in my git repo, I can ensure that I track configuration changes and keep my configuration file secure (at least as secure as the token I generated for access) .
A recommendation for the more security conscious would be to modify the default configuration loading process of ethOS to use an private key to clone the config file from a repo instead of access-by-token. However, the security of the modification of the configuration file is more important than the privacy of the file itself.
Setting Up AWS Lambda#
For managing our infrastructure in AWS, we’re going to use an AWS CloudFormation abstraction called the Serverless Application Model (SAM). In our application repository, we’re going to create a SAM file with the following contents:
This SAM takes 5 properties, an AppName, EthosDistroUrl, AccessKey, BucketKey and EtherAddress. In order to deploy this template, you’ll really only need to supply:
EthosDistroUrlwhich will look likehttp://<<custompanel>>.ethosdistro.com/?json=yesAccessKeythis is your Initial State account access key. Login and create a Bucket. Once your bucket is created, you’ll be able to go to it’s settings and copy theAccessKeyfor this param.BucketKeysimilar to theAccessKeyparam, you’ll need theBucketKeyyou’ll be using as well.EtherAddressthis is your Ethereum Wallet’s public address, like0xDEB683AD773262dB157b32e5ad5406801145CC37. ThenanopoolAPI requires this to report on your specific stats. In addition tonanopoolI occasionally usealpereumwhich is a separate pool. My monitoring scripts monitor both pools.
If you look at the anatomy of the SAM, it defines a Resources section. Inside Resources I’m defining every AWS Resource that will be required to run the infrastructure for this application including the Lambda execution permissions as described by ServiceIAMRole.
There are 4 Lambda functions, 1 DynamoDB table and 1 SNS topic that are created in addition to the IAM Role. The Lambda functions are as follows:
MinerWatchService: This service is responsible for polling thehttp://<<custompanel>>.ethosdistro.com?json=yesurl to get the data for each rig in your mining farm. The code for this service then takes each per-rig JSON object and sends a notification to the SNS topic we created with the resourceRigDataSNS. In addition to sending notifications per-rig, it also streams some of the master-level data to a master bucket in Initial State. This is the bucket you created to generate the BucketKey and AccessKey you passed to the template.PerRigSendService: This service is responsible for handling the per-rig detailed data. This data is streamed to per-rig BucketKeys to Initial State. It uses the sameAccessKeyprovided in the params, but appends-123456where123456represents the rig hash/hostname (ethOS uses the second half of the network MAC address for this value so it will be easy to identify and unique). It’s important to note that this service does not create the Initial State bucket that it sends data to, but instead, just sends the data blindly. You’ll want to create the bucket on the Initial State side in order to actually see the per-rig data.CryptoNanoPoolMonitorService: This service is responsible for polling the nanopool API to get information on my farm’s performance as measured by the pool. This is so I can use this data later to grade the pool/network performance against my locally reported hashrates. I have another function for monitoring alpereum as well, but have switched to nanopool as it’s become the default for ethOS. I recommend using whichever pool you like that provides services geographically close to you. For whichever pool you use, you’ll just need to update the code to leverage that pool’s API instead.CryptoNetworkMonitorService: This is a service that’s responsible for monitoring the etherchain.org API for collecting Ethereum network data. This data proves interesting not just for tracking the changes and growths of the Ethereum network but for also performing economic expectation calculations with Initial State’s real-time Expressions.
The DynamoDB Table is used as a checkpoint table to keep track of rolling sums as well as hashrate data since sometimes pools provide an instantaneous API and sometimes they provide a time-series API with no ability to query the API for a specific time range to reduce duplicate data. This table provides simple, stateful storage of checkpoint information to solve this issue.
Lambda Code#
NOTE: I will be making the code available as open-source on GitHub soon! Stay tuned or message me on Twitter @davidsulpy you’d like it!
Deploying Infrastructure#
Packaging and deploying SAM templates is very easy with the AWS CLI. It’s a simple command:
aws cloudformation package --template-file sam.yaml --s3-bucket <<YOUR_BUCKET>> --s3-prefix miner-watch --output-template-file sam-output.yamlThis package command will then output a deploy command that looks like this:
aws cloudformation deploy --template-file $OUTPUT_TEMPLATE \
	--stack-name miner-watch \
	--parameter-overrides EthosDistroUrl=$ETHOS_DISTRO_URL AccessKey=$IS_ACCESS_KEY BucketKey=$IS_BUCKET_KEY EtherAddress=$ETH_ADDRESS \
	--profile $AWS_PROFILE --region $REGION \
	--capabilities CAPABILITY_IAM
Note that this command has parameters in it that need to be assigned or replaced with the appropriate values. If you only have one AWS account in a default region configured, you don’t need the --profile $AWS_PROFILE --region $REGION flags.
For extra bonus points, do all of this with AWS CodePipeline. I’ll post a later post on how to bootstrap and orchestrate continuous delivery using AWS CodePipeline and CodeBuild which will flow nicely as an extension of this AWS architecture. This is how I currently deploy so that new changes committed to GitHub are automatically and continually delivered to my Lambda functions.
The Final Results#
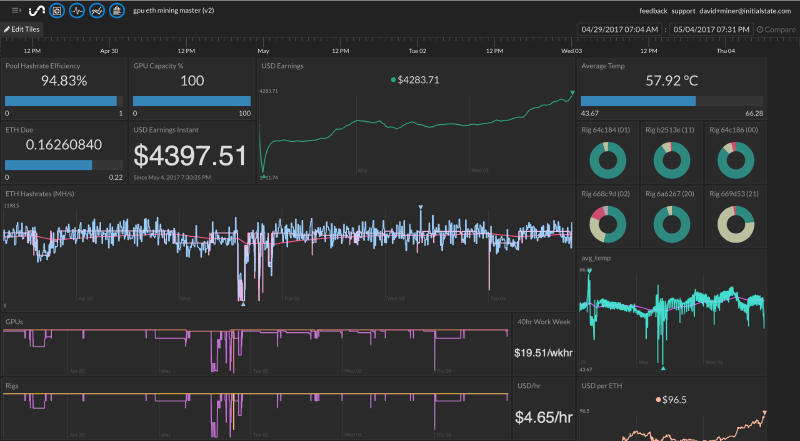
This is the primary dashboard setup on Initial State that I use to monitor the economics of my mining farm operation.
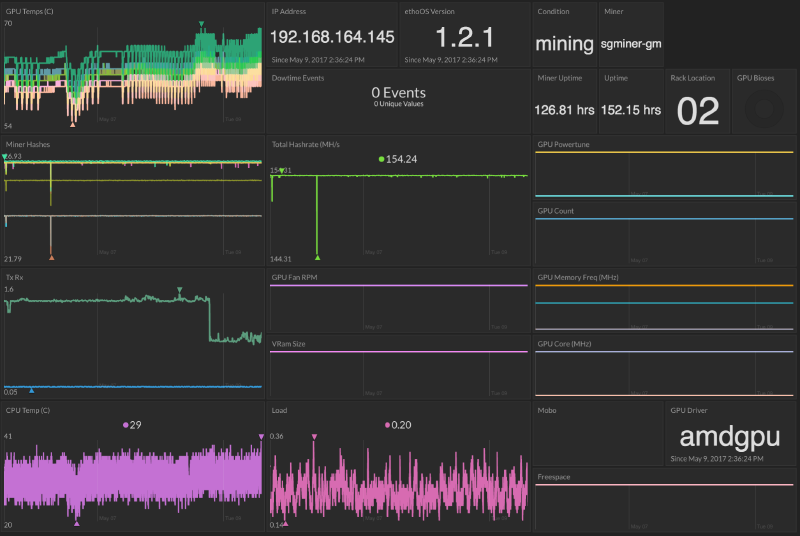
I also have a set of rig-specific dashboards that give me a little more detail into the rig’s operations for troubleshooting.